Infrastructure & industrial sites
Visible changes to structures, storage areas or surfaces around a defined site.
Image change detection & monitoring
Compare suitable images from different dates to highlight visible changes, support site reviews, and build a more consistent monitoring workflow.
 Date ADate B
Example visualisation
Date ADate B
Example visualisation
What can be assessed
Potential examples, always subject to the source imagery and the agreed analysis scope.
Visible changes to structures, storage areas or surfaces around a defined site.
Expansion or modification of built-up areas between suitable image dates.
Differences in vegetation, bare ground and other surface types between dates.
Changes in selected field or environmental features where the imagery supports it.
Visible changes around ports or other facilities when resolution, date and viewing geometry are suitable.
Change review for a defined site, such as construction progress, where repeat imagery exists.
The monitoring workflow
Careful preparation is what separates a real change from a difference in lighting or alignment.
Agree the area or asset and the type of change that matters to you.
Identify image dates and sources that can answer the question.
Co-register and preprocess imagery so the comparison is meaningful.
Apply change analysis and review potential artefacts and false changes.
A change layer or annotated image, a summary, or a repeat-analysis output as agreed.
Engagement models
Analyse two or more relevant image dates to answer a specific question — for example, what changed on a site between two inspections.
Repeat the analysis at an agreed cadence when new imagery is available and licensed for the intended use, using a consistent method each time.
How often can imagery be updated? That depends on when imagery is acquired, the sensor's revisit, provider availability, weather and cloud for optical data, and licensing. We do not offer real-time or guaranteed daily monitoring; the cadence is agreed once data availability is confirmed.
What can cause a false change?
Two images of the same place almost always differ. Preprocessing and validation separate meaningful change from these effects.
Vegetation, crops and water levels vary naturally through the year.
Different sun angles move and lengthen shadows between dates.
Optical imagery can be partly obscured or reduced in contrast.
Colour, band and processing differences between sources.
A sharper image reveals detail that was not visible before.
Small registration errors make edges look like new change.
Off-nadir views shift tall objects and change their footprint.
Moving vehicles, temporary storage and everyday activity.
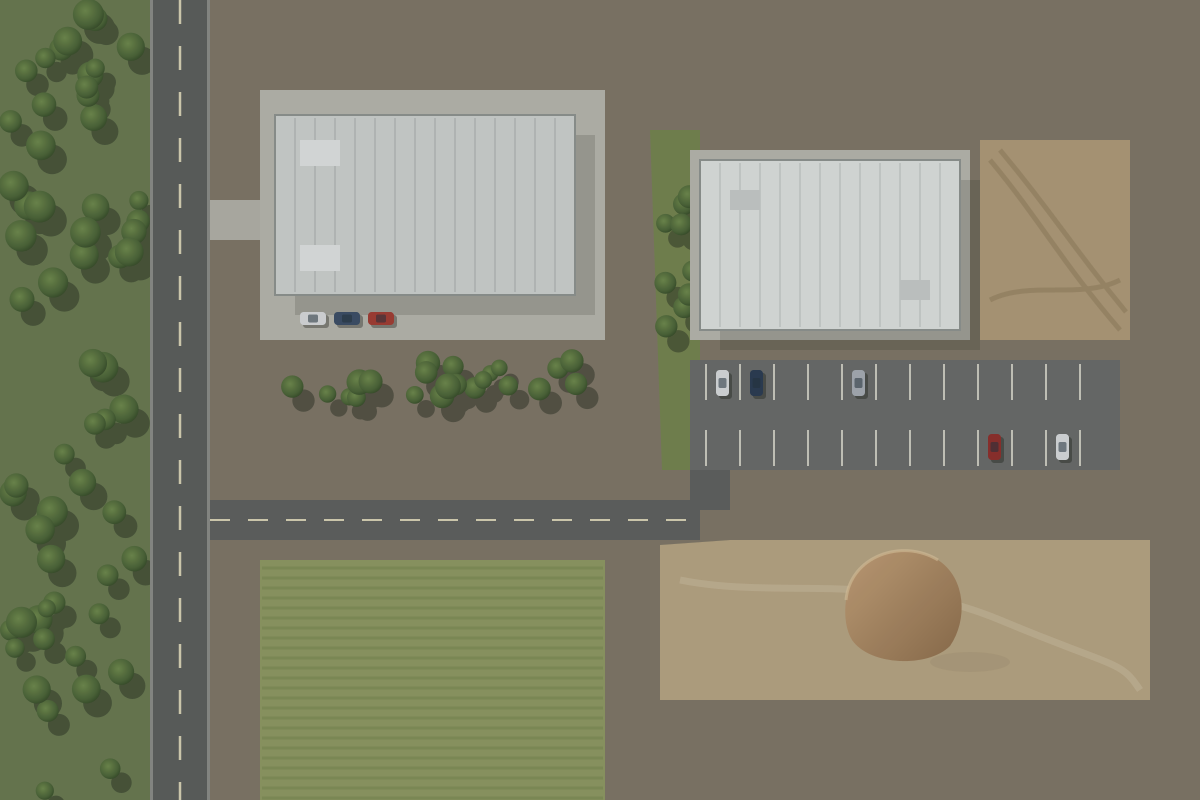
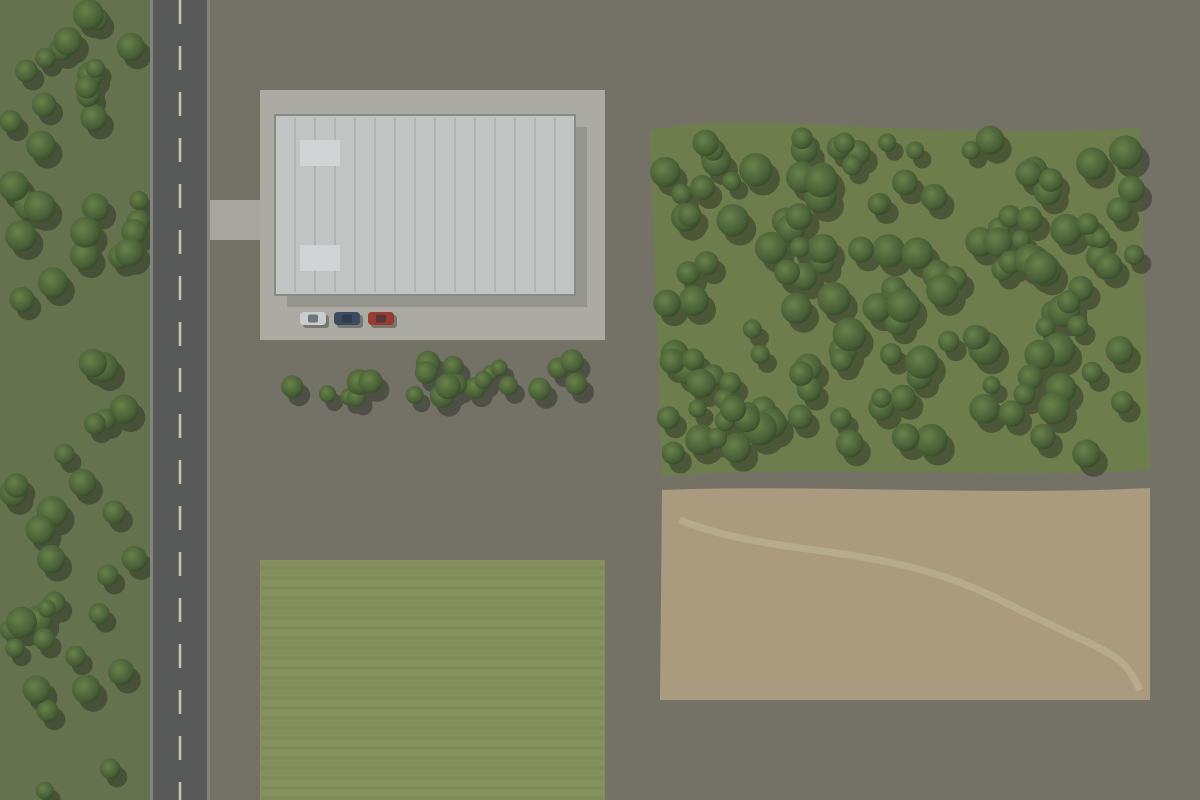
In the example above, Date B has a warmer ground tone and longer shadows than Date A. Those are lighting differences, so they are not marked as change.
Output examples
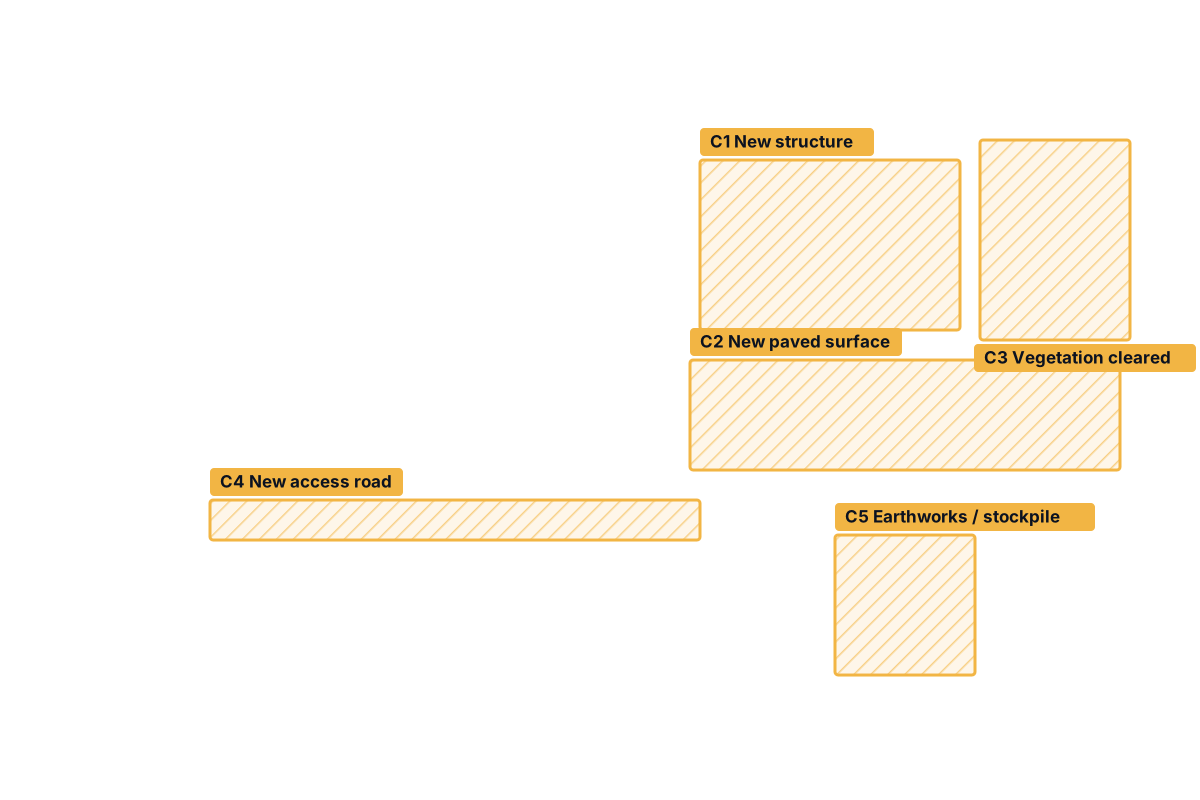
An illustrative change summary for the example scene. Region IDs match the highlighted areas in the comparison above.
| Region | Change type | Share of image | Review |
|---|---|---|---|
| C1 | New structure | 4.6% | Confirmed |
| C2 | New paved surface | 4.9% | Confirmed |
| C3 | Vegetation cleared | 3.1% | Confirmed |
| C4 | New access road | 2.0% | Confirmed |
| C5 | Earthworks / stockpile | 2.0% | Confirmed |
Shares are region bounding-box areas as a percentage of the example image. With georeferenced imagery, areas can be reported in square metres or hectares.
Summary. 5 change regions were identified between Date A and Date B. The main change is new development in the eastern plot: a new structure (C1) with an adjoining paved area (C2), connected to the road by a new access route (C4).
Notes. Vegetation was removed in the north-east (C3) and an earthworks area appeared to the south (C5). Differences in ground tone and shadow length were attributed to lighting and not reported as change.
FAQ
Only if suitable archive imagery exists for that location and date, at a resolution that shows the change you care about, and under a licence that allows the use. We check availability before scoping.
No. The analysis uses images captured on specific dates. Newly acquired imagery is used when it becomes available; we do not offer live or real-time views.
It depends on the image resolution and the contrast between the change and its surroundings. A change must cover enough pixels on both dates to be distinguished reliably from noise and misalignment.
Related services
Change analysis often builds on object detection or land-cover classification performed on each image date.
Tell us about the area or asset, the type of change that matters, and how often you would like to review it. We will check what imagery is realistically available.