Image preprocessing
Quality checks, normalisation, band handling and preparation for downstream analysis, where supported by the source.
Satellite image analytics
Use image-processing and analytical workflows to extract features, classify image areas, assess patterns, and prepare data that supports a defined business or operational question.
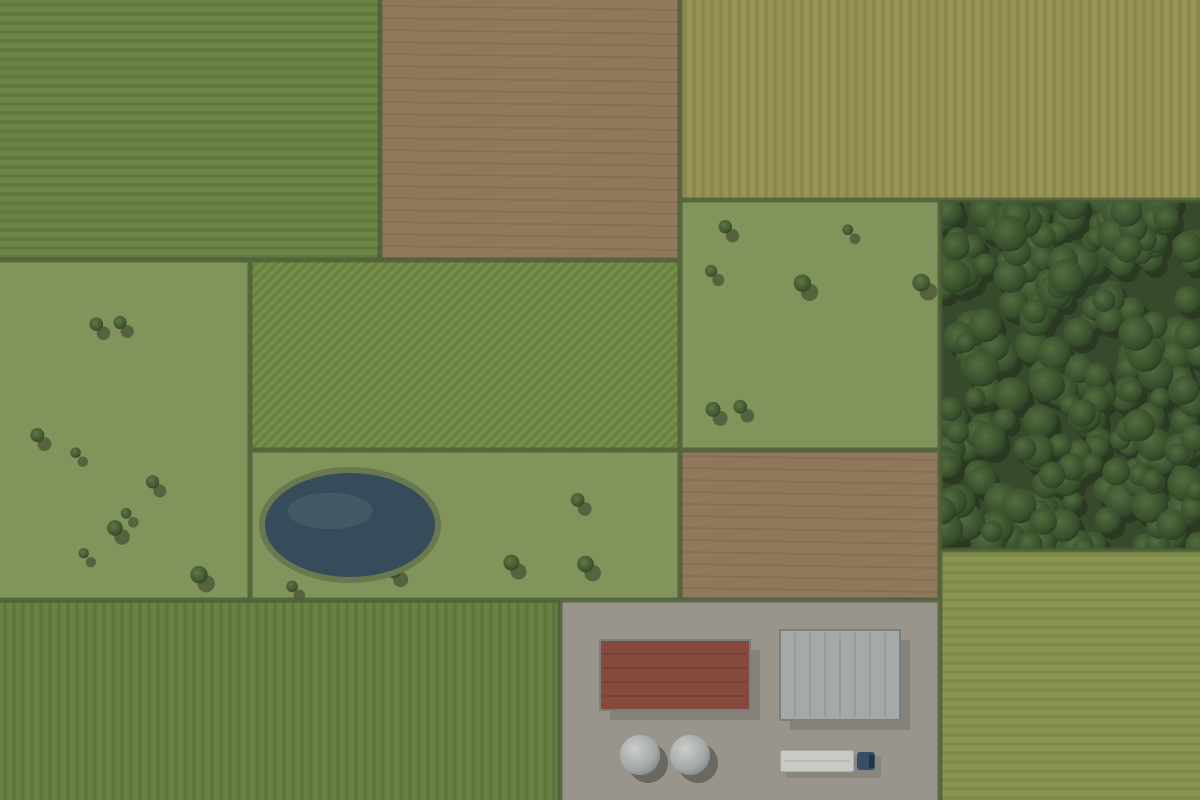
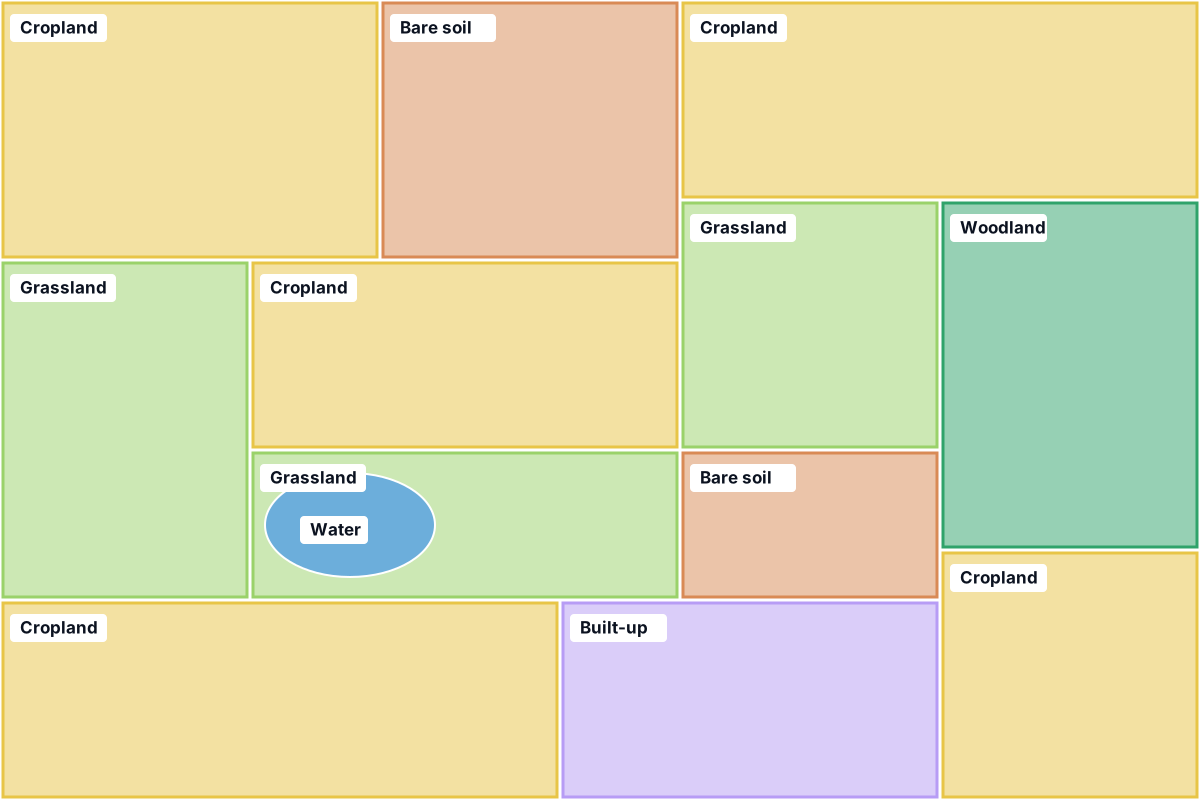 Example visualisation
Capabilities
Distinct from finding individual objects or comparing dates, image analytics turns whole images into measurable, structured information. Each capability is used only where the source data supports it.
Quality checks, normalisation, band handling and preparation for downstream analysis, where supported by the source.
Derive measurable image features or visual characteristics relevant to the question being asked.
Classify broad surface categories when the sensor, resolution and methodology are suitable.
Calculate approximate areas or counts where resolution, georeferencing and validation support meaningful results.
Use several spectral bands when the source data includes them and the use case supports it. Not every image is multispectral.
Organise suitable outputs into structured tables and spatial datasets ready for your own tools.
Present findings, assumptions, quality notes and limitations in a format decision-makers can follow.
From pixels to useful results
Each stage is documented, so you can see how a result was produced and what it depends on.
Potential applications
Suitability depends on the question, the sensor and its bands, whether a time series is available, the resolution, and what reference information exists to check results against.
Estimate the share of broad surface types across a defined area.
Assess vegetated versus bare surfaces, where appropriate bands are available.
Characterise land cover around a site or within a study area.
Compare the composition of several sites using the same method.
Prepare consistent, analysis-ready data for your own models or GIS work.
Example outputs
Illustrative outputs for the example landscape above. Percentages are computed from the areas drawn in that example image, not from a customer project.
Example visualisation| Class | Share | Proportion bar |
|---|---|---|
| Cropland | 48.1% | |
| Grassland | 20.9% | |
| Bare soil | 12.2% | |
| Woodland | 9.5% | |
| Built-up | 7.9% | |
| Water | 1.4% |
class,share_of_image_pct
cropland,48.1
grassland,20.9
bare_soil,12.2
woodland,9.5
built_up,7.9
water,1.4A concise report sets out the question, the imagery used (source, date, resolution), the method, the results, quality-review findings, and the limitations to keep in mind when using the numbers.
With properly georeferenced imagery, areas can be reported in hectares or square metres and exported as spatial datasets, rather than as shares of an image.
FAQ
No. Some imagery only provides visible colour (RGB) or a single panchromatic band. Multispectral methods are proposed only when the source provides the bands the analysis needs.
They are approximate. Accuracy depends on resolution, how clearly classes can be separated, georeferencing quality and how the output is validated. Reports state these assumptions alongside the figures.
Often, yes. We check whether each of your classes can be distinguished in the available imagery and suggest merging or adjusting classes where it cannot.
Related services
Analytics outputs feed naturally into change comparisons or custom processing pipelines.
Share the question you need answered, the area of interest, and any imagery or reference data you already have.